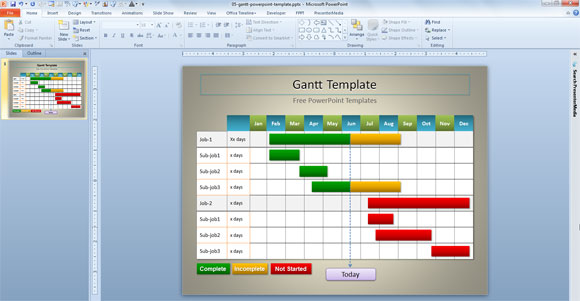
Gantt Chart In Powerpoint 2010: Steps To Follow
Asked By
10 points
N/A
Posted on - 08/01/2016

How to create a Gantt chart in PowerPoint 2010 using copy picture feature? What are the steps we should follow to complete this task?


