Infographics are a great way to get your message across. They can be fun and interactive, or they can be purely informative. But they take some time to create, so you want to ensure you have all the necessary tools. Fortunately, plenty of free tools out there make creating infographics easy enough for anyone to do. In this article, we’ll take a look at 10 of them:
1. Visme
Visme is a free tool that allows you to create an infographic in minutes. You can also add your text or images.
Visme is very popular among people who want to create infographics for their business or blog because it’s so easy to use. It also comes with many pre-built templates that you can use if you have little time (or know how) but still want something professional looking on the page that people will see when they visit your site or app!
You’ll find several different types of infographics here, including:
- Charts & Graphs – This type features graphs that show data over time using bars, lines, and other visual elements such as arrows pointing out specific points in terms of numbers/percentages, etcetera.”

2. Piktochart
Piktochart is an online tool that allows you to create infographics. It has a wide range of templates and a drag-and-drop interface, which makes it easy to use. The program also has a variety of design templates, chart types, and map types.
Piktochart also offers several free designs with varying themes:
- Data Visualization Graphs (this one uses the data visualization template)
- Presentation Design Templates – this includes graph layouts using bar graphs or pie charts

3. Canva
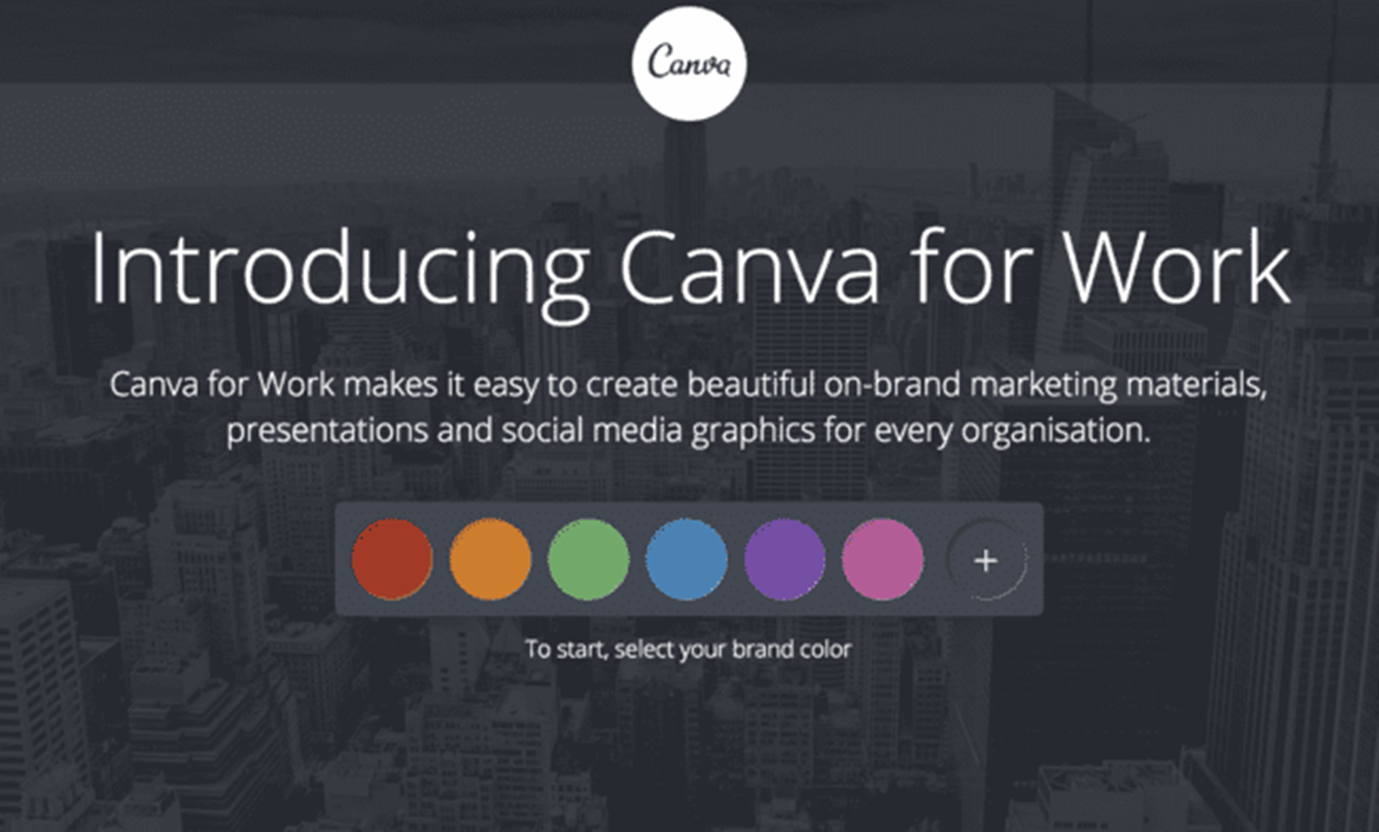
Canva is one of the most excellent tools for generating infographics. It has a massive selection of templates and is easy to use, so that anybody can create professional-looking infographics with Canva.
Canva is great for non-designers who want to create professional-looking infographics for their blog, social media, or website. You don’t need any design skills or experience in Photoshop or Illustrator, which makes this tool perfect for beginners!
4. Infogram
Infogram is a free tool that allows you to create charts and graphs. You can make charts, maps, and other visualizations using Infogr.

5. Venngage
Venngage is an excellent tool for creating infographics. It’s easy to use and has a great selection of templates to create infographics on your desktop, mobile, or tablet. You can also choose from hundreds of fonts in the accessible version of Venngage if you want to add more style to your infographic design.

6. Easel.ly
Easel.ly is a free tool for creating infographics and is easy to use. You can add your images, text, and shapes and customize the templates to create an infographic that fits your style. You can also create interactive infographics with Easel.ly!

7. Dipity
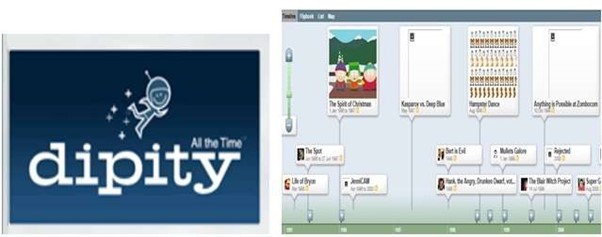
- Create a timeline
- Create a biography
- Connect with people
- Embed media into your infographic
8. Visualize. Me
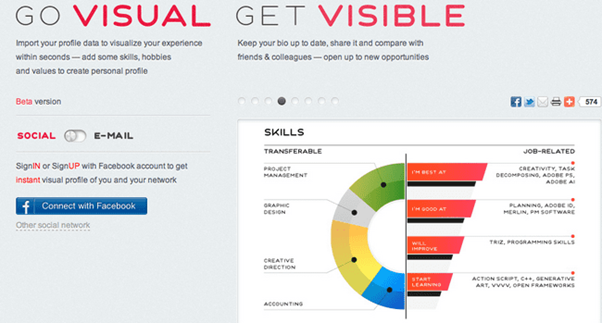
Visualize.me is a free tool for creating charts and other visualizations. It’s easy to use and has a variety of templates, including infographics, diagrams, flowcharts, bar graphs, and more. You can also import your images into the platform if you need something more specific than what they offer in the pre-made templates. You can view any chart or graph on VisualizeMe in real-time by clicking on an icon next to it (like this one). It will open up a new window where you can see exactly how it looks on your screen size before exporting it as an image file for use in other applications like PowerPoint or Word documents/spreadsheets.
9. Google Charts
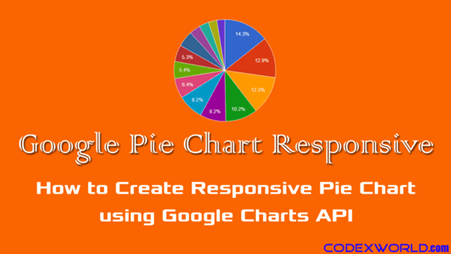
Google Charts is a free tool that allows you to create charts, graphs, and maps. It’s integrated with Google Drive and gives you access to over 50 chart types, including line graphs, bar charts, pie charts, and more. You can add data from your spreadsheet or import it from other sources such as Excel spreadsheets or Access databases. You can also select the data type (time intervals) for your chart and choose how many series you want in each category. There are many different ways of formatting this information depending on what type of information needs, even though there are few restrictions on what kind of presentation style one could use here because all these options are very flexible!
10. Hohli Chart Maker
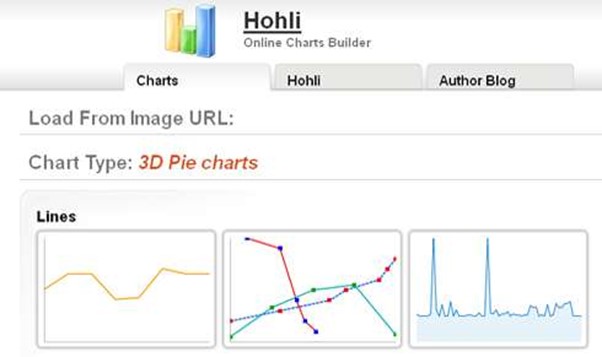
Hohli Chart Maker is a free chart maker that allows you to create various charts. You can create bar charts, line charts, and pie charts. Hohli Chart Maker has many features, such as exporting your chart in .png or .jpg format for use on websites or social media platforms like Twitter and Facebook. The software also includes an advanced data editor, which allows you to add text to your graphically created image using HTML5/CSS3 code syntax (if desired).
Conclusion
We hope that these ten tools help you create infographics that stand out. Whether you’re just getting started or have been producing quality work for years, these tools can make your work look more professional and increase engagement with your content. You can read some of our old blog posts by clicking here.


