How To Create A Gantt Chart In Excel 2007?

Asked By 0 points N/A Posted on -
qa-featured

Hello everyone,

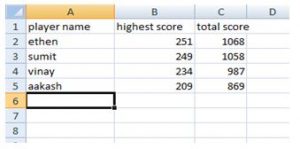
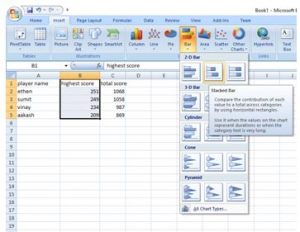
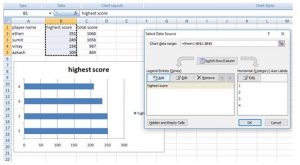
I am currently working on Excel 2007, and I’m having a record of the few students for which I want to create a chart for better comparison. Please guide me through the steps to create a Gantt chart in Excel 2007.

SHARE
Answered By 30 points N/A #305021

How To Create A Gantt Chart In Excel 2007?

qa-featured

Let’s take an example similar to our problem.

I have a record of few players.

So, first create a bar chart for them.

Now the result will be:

Add duration to the graph.

For that right click on the chart and click on select data.

Click on add in the next window.

Select the small edit icon in the series value, and provide the suitable name to the project.

Drag the values of highest score.


Press enter.

There will one more field added to the legend series ‘duration.’

Again open select data. This time click on edit.

Select the axis label as the name of the player.

Click on ok.

The result will now be.

Again click OK.

Now delete the chart labels.

Now it’s time to convert the excel graph to Gantt chart. Select the blue bars and right click and choose format data series.

Click the no border line.

After this, your chart will look like a Gantt chart.

Related Questions