Asked By
jhana marie
10 points
N/A
Posted on - 02/10/2014

I am profiling some codes on my Visual Studio through Windows 8 Pro. But every time I try to launch the profiler, it seems that is is being blocked and I can't start it. I tried to uninstall VDPerf and reinstall it using the vsperfcmd only to be presented with the error below. Can someone help me on resolving my dilemma? Thanks in advance.
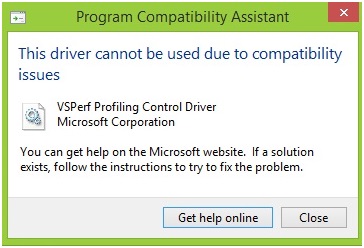
Program Compatibiliy Assistant
This driver canot be used due to compatibility issues
VSPerf Profiling Control Driver
Microsoft Corporation
You can get help on the Microsoft website. If a solution exists, follow the instructions to try fix the problem.
Get help online Close
Compatibility Issue on Profiling Code in VS with Windows 8
That is maybe true because at the moment there are still very few applications and packages that support Microsoft Windows 8. And to think that it is still very new and is still less supported, Microsoft still decided to release Microsoft Windows 8.1 which obviously majority of the programs I’ve checked haven’t released their version that will support it.
If you want to use the VSPerf Profiling Control Driver available in Microsoft Visual Studio in Microsoft Windows 8, you need a much higher version of Microsoft Visual Studio like Microsoft Visual Studio 2013 to make it more compatible. In this task, you need to use the tool “VSPerfCmd.exe” to start and stop the performance data collection using this syntax: VSPerfCmd [/U] [/options].
The “/U” switch should be the first option to specify if you’ll be using other switches with the tool. Here, the redirected console output is outputted as Unicode or in Unicode format. Start:mode, this option initiates the profiling service using or in the indicated mode. Change “mode” to your desired mode.
When using /Start, the syntax would be: VSPerfCmd.exe /Start:Method. “Method” should be one of the following:
-
TRACE – this specifies the method of instrumentation.
-
SAMPLE – this one is for sampling method.
-
COVERAGE – this is for code coverage.
-
CONCURRENCY – this is for the resource contention method.
Visit Running VSPerfCmd on Microsoft Windows 8 for the complete instructions and specifications.


