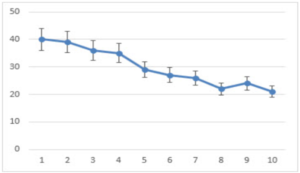
Hi, I am considerably new to Microsoft Excel. I am working with charts, and I have trouble adding error bars to chart. I want my chart to show the margin of error as shown below-
How to add error bars in Excel so that I can achieve the desired structure? Thanks in advance!
Can I know how to add error bars in Excel on Windows 10.
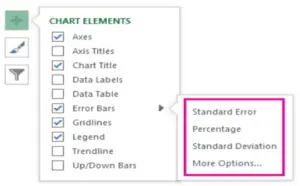
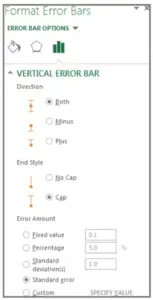
Hey! I went through this when I started off with excel too, and this is what I found. Here’s how to add error bars in Excel? Firstly, select the chart at a random point. Click on the “Chart elements” and choose the “error bar” box. If you want, you can change the error amount from the arrow icon adjacent to the “Error bar”.
From “More options,” set your customized amounts.
You are done!