Questions about Formula in Excel

Asked By 210 points N/A Posted on -
qa-featured

Hello,

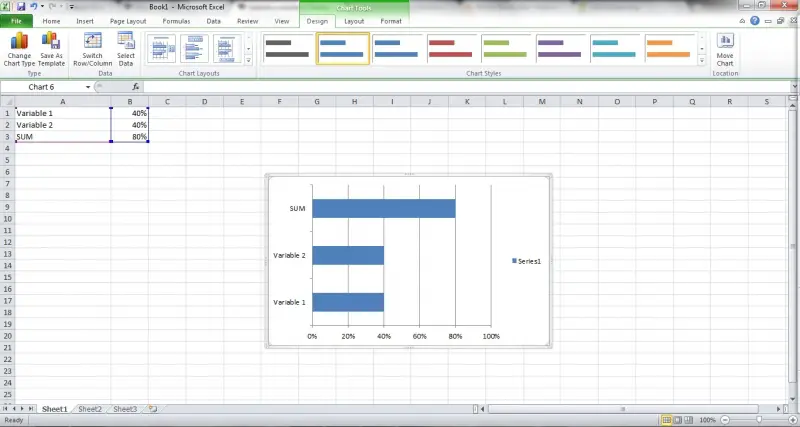
I have a query about Excel. How can I receive a column (bar chart) which will include variables as a sum?

For example: I have variables: A and B. A =20% and B=40%. I require a column which will depict the sum of these variables (60%). But I require in the column to be obvious that from the 60% the 20% comes from variable A and the 40% from variable B. So, the Column ought to be divided in two parts (in proportion).

Lots of thanks.

SHARE
Best Answer by Chriss
Best Answer
Best Answer
Answered By 0 points N/A #82580

Questions about Formula in Excel

qa-featured
  • You first have to create a 3rd variable in another cell with the following formula: =SUM(A+B)
  • Now this cell will show you the exact sum of both variables. Whenever any variable value changes the SUM will also change automatically.
  • Now select the cell which is displaying SUM and then click on the insert menu and select your bar. The bar will be exact as your variable. It will also change when the variables change.
     
Answered By 0 points N/A #82582

Questions about Formula in Excel

qa-featured

First you have to enter data in two contiguous columns in Excel sheet. Then select the range of data with their title rows which you want to plot the chart with.

  • Click on the Insert tab.
  • Click on the down arrow in the Bar charts tab in the Charts group. Now you can see different views of bar charts.
  • Select the Stacked Bar chart from the 2-D Bar charts group.
  • Now you can get the chart shown as in the figure.
  • If you need to change the chart options select the chart and right click on it.

Hope this would solve your problem.

Related Questions