How to create cascade charts excel 2010
Asked By
30 points
N/A
Posted on - 04/30/2013

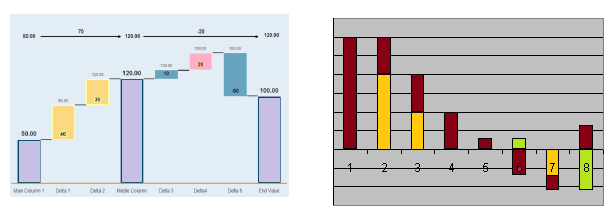
I am a statistician and I would like to create a cascade chart that would create and show all bars bridge from one end to the other. However, I have a negative value for my equations and I am wondering if it will show on the cascade chart excel that I am currently using. I use the 2010 version of excel cascade chart. Would it be possible to have the bars still bridged from one end to another with the negative values for my data?


")


