Data analysis is data collection through reasoning and interpretation to find solutions to specific questions. Data analysts and other software professionals use various tools that give the best results in several tasks. These tools are data analytics tools that help develop and perform analytical processes optimizing the business performance. It also helps in decreasing costs and increasing company profits. With many tools available, choosing the right one is challenging. Firstly, you must analyze the types of data and the data integration requirements. Secondly, consider your business needs and check whether using different tools fits your requirements. In this article, we have listed the ten best analytics tools for various types of analytic processes.
1. Microsoft Excel
Microsoft Excel is a well-known spreadsheet software available commercially ideal for data analysis. It is compatible with all Microsoft applications with features like pivot tables, export data, rows, and columns where you can manipulate the equations. You can handle smaller processes effectively using workbooks and plug-ins. One of the limitations of Excel is it is poor at handling big data.
2. Python
Python is an open-source programming language. It has simple syntax and coding processes. It easily integrates with other languages like C, C++, Java, PHP, etc. With more than 200000 packages, it handles thousands of free libraries that suit a variety of data analytics tasks. Python is highly versatile and easy to learn, but its limitation is memory intensive.
3. R
R is also an open-source programming language used for statistical analysis and data mining. With more than 15000 packages, it provides extensions for a distinct type of data analysis. It has graphical libraries and performs complex mathematical operations by a single command. Although highly compatible and platform-independent, it is slower, less secure, and the syntax is more complex to learn than Python.
4. Apache Spark
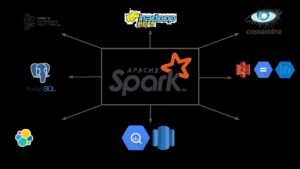
It is an open-source data processing framework used for big data processing and machine learning. It has a collection of 100 operators for transforming and operating on large-scale data. The tool works exceptionally fast in that it gives a speed of 100x faster than Hadoop. Its limitation is that it consumes more memory, lacks a file management system, and has a rigid user interface.
5. SAS
SAS is an abbreviation for Statistical Analysis System. It is a commercial statistical software suite used for business intelligence and predictive analysis. The tool is robust, versatile, easily accessible, business-focused, and has good user support. Since it is commercial, it has a high cost with new modules added per customer demand. The other limitation is it has a poor graphical representation.
6. Jupyter Notebook
Jupyter Notebook is open-source interactive authoring software used for sharing code, creating tutorials, and presenting work. You have live codes, equations, visualizations, and narrative text. The tool supports more than 40 languages, integrates with big data tools, and offers different outputs from HTML to images, videos, etc. Its limitations are that it has poor version control and is unsuited for collaboration.
7. Microsoft Power BI
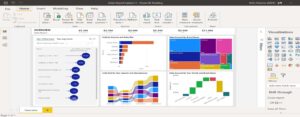
Microsoft Power BI is a business analytics suite used for data visualization and predictive analysis. Users can create and share reports, visualizations, and dashboards. It offers robust data connectivity and regular updates. Power BI allows the building of automated machine learning models and integrates with Azure machine learning. The drawbacks are a clunky user interface, rigid formulas, and low data limits.
8. Tableau
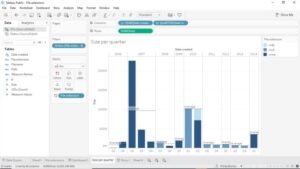
Tableau is a commercial data visualization tool used for creating data dashboards and worksheets. It handles large amounts of data and is simple to use. A visual drag-and-drop interface is the best advantage of Tableau over other tools. Also, the other features include good speed, interactivity, and mobile support. Its limitations are that it has poor version control and is unsuitable for data pre-processing or complex calculations.
9. KNIME
KNIME stands for Konstanz Information Miner. It is a free, open-source data integration software used for data mining and machine learning. This tool supports data integration, processing, visualization, and reporting. The drag-and-drop graphical user interface makes it best for visually-driven programming. Multi-threaded data processing is one other good feature. Its main limitation is that it lacks scalability, and it requires technical expertise for some functions.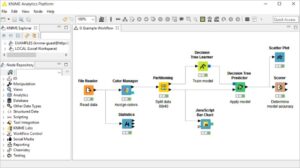
10. RapidMiner
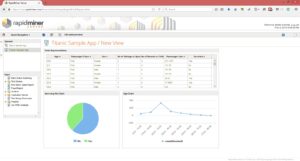
RapidMiner is a user-friendly software tool used for machine learning, data preparation, and predictive model operations. With more than 1500 algorithms, it provides a comprehensive data science and machine learning platform. Additionally, it integrates with languages Python and R and supports database connections. Its disadvantage is that it consumes too much memory, slows down the system, and is difficult for new users.
Conclusion
A good data analyst must have a wide-range knowledge of software tools suitable for businesses. Data analytics is a modern solution to help analysts perform their tasks efficiently with minimum error. The above-described tools will give you the insights required to choose the best tool for your analytical processes.


