Easier ways to convert my financial data into a graph presentation?
Asked By
10 points
N/A
Posted on - 10/09/2011

Good day!
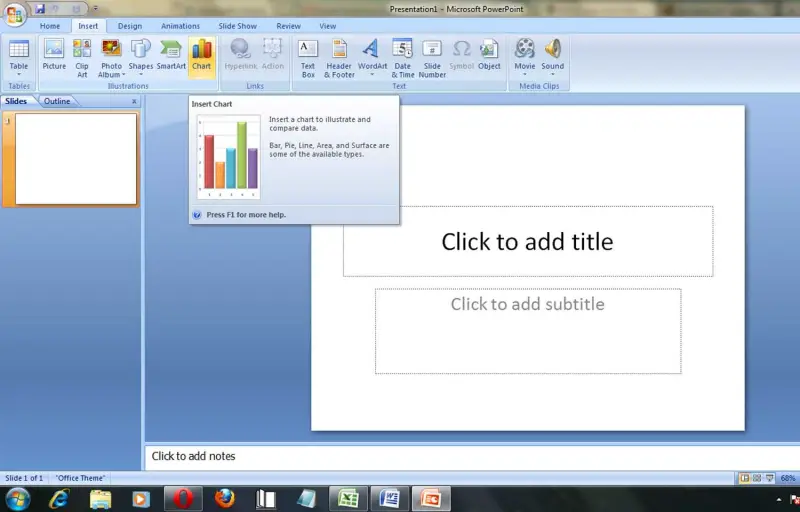
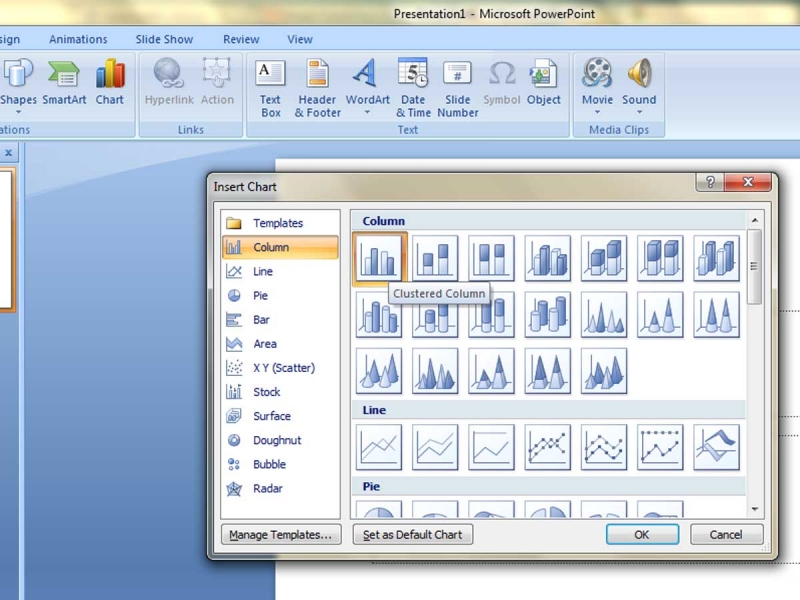
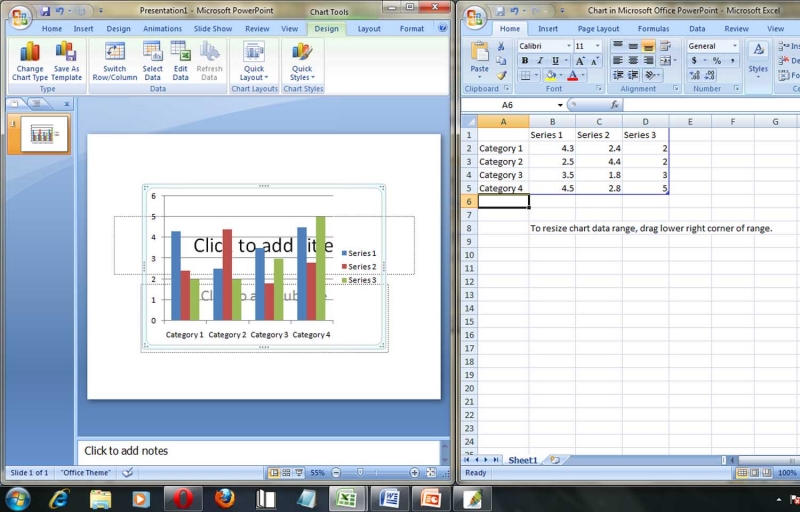
I am working as an office personnel who is obliged to report to the Board of Directors regarding the financial status of the company I am working with. In order to make my presentation more comprehensive, I want to present it in a graphical way to present the whole overview of the monthly financial performance of the operation.
My data is complete. The lacking is the procedure on how to encode or to do it in such a way that my audience could picture out comprehensively in order to come up a right decision for the organization.
Thank you.
I will wait for your response.
Truly yours,
Rubilee Virtudazo


")


