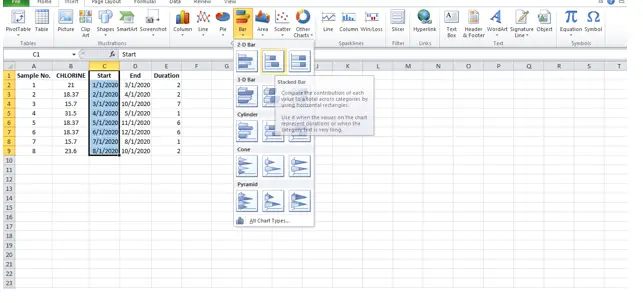
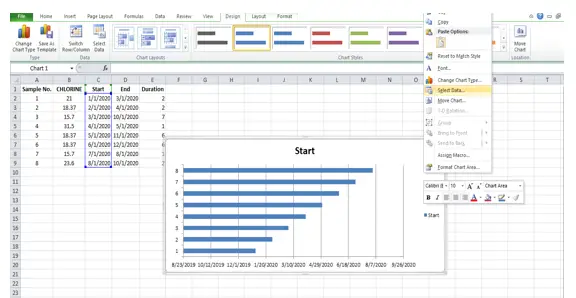
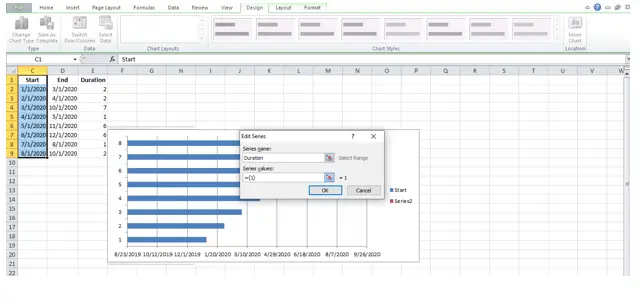
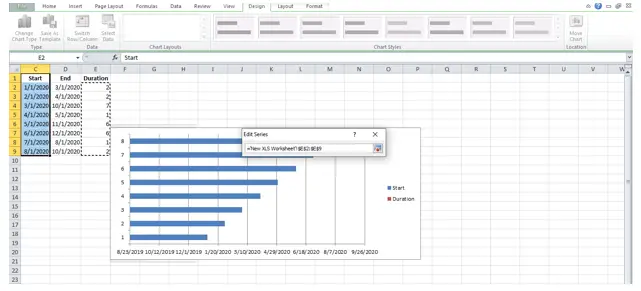
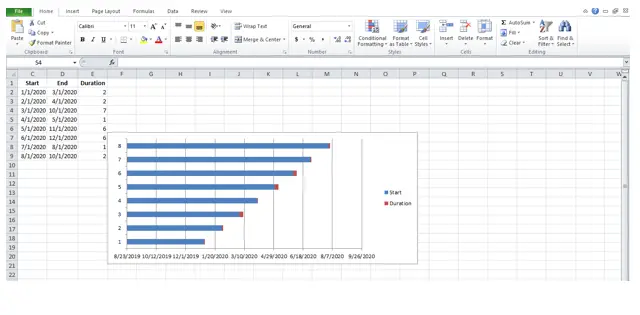
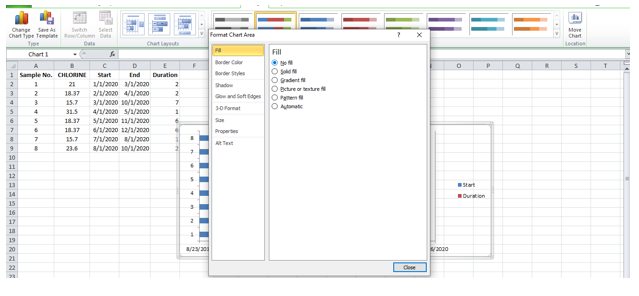
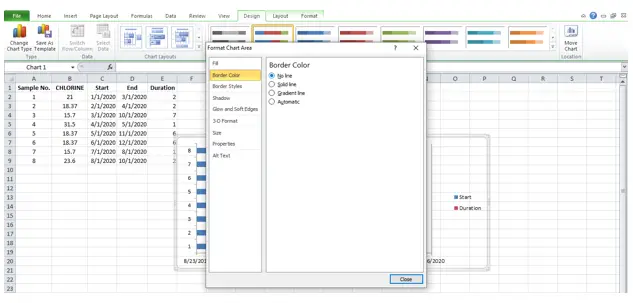
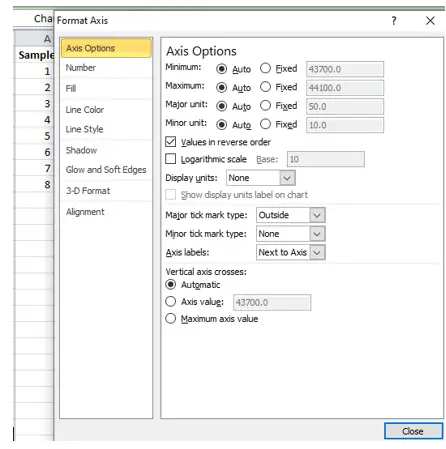
Creating Gantt Chart In Excel
Asked By
0 points
N/A
Posted on - 07/09/2020

I am having trouble creating Gantt chart in excel. Can you please teach me how to create one. It would be really helpful!

")


