
Hello experts,
I want to add charts to my Excel sheet. Please provide me the steps to add horizontal error bars Excel and standard deviation in Excel 2013.
How To Add Horizontal Error Bars Excel And Standard Deviation In Excel 2013?
To add error bars and standard deviation to Excel chart, you need to generate graph first.
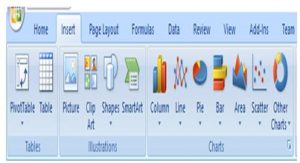
To add a graph to the sheet use insert option.
In the charts pane uses the required graph you need.
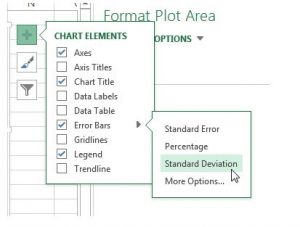
When the plan appears on the sheet, right-click on the chart and choose error bars option.

Error bars will bring a new side option pane with more choices, select standard deviation.
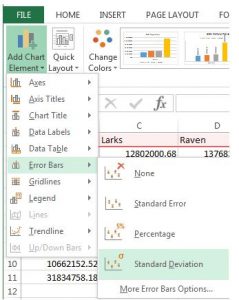
You can also insert the standard deviation to the sheet by using add chart element option.


