I am a statistician and I would like to create a cascade chart that would create and show all bars bridge from one end to the other. However, I have a negative value for my equations and I am wondering if it will show on the cascade chart excel that I am currently using. I use the 2010 version of excel cascade chart. Would it be possible to have the bars still bridged from one end to another with the negative values for my data?
Based on your summary question you want to know how to make cascade charts, but after reading your questions in details, seems like you already know how to make cascade charts and is just concerned about the negative values so here you go:
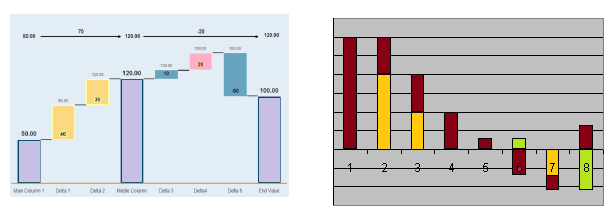
Your first question is if negative values will show up in the chart.
Yes it will show up.
Your other question is if it’s possible to have the bars bridged with the negative value.
Yes that is also possible, as you can see in the examples below, the negative values are showing up but the bars are still connected from one end to the other.
If you want the step by step guide, you can also watch this video below
Mirrorless camera is the latest obsession among the photographers. The cameras have altogether replaced the traditional DSLR models with their unique and special features.
A mirrorless camera is a light-weighted electronic device device that utilizes...
Every author expects to experience a sense of achievement unlike any other when they complete their manuscript. However, some authors agree that they do not feel fully satisfied looking back at the achievement that...
It is a type of digital currency. It can be consumed or negotiated, but it is not issued by central banks or retained in financial institutions. It enables transactions without involving central banks or...
The finest laptops are powerful enough to do your daily tasks, comfortable enough to use all day, and power-efficient enough to ensure you don't run out of battery power unexpectedly. Of course, all these...
Before getting into knowing the facts, let’s have a brief about the Dark Web. The dark web is the data of the World Wide Web that is accessible only through special software, combinations, or...
While looking for a chemical-free way to clear and purify both durable and low grounds in your home, a steam cleaner is an excellent solution. With a spurt of superheated steam, this cleaning equipment...
Internet monitoring software keeps a log of all internet activities. You can install this type of software on your computer remotely or by the administrator. An operating console controls this software. This type of...
A Hard Disk Drive is usually partitioned into various smaller drives for optimization. A partition manager helps make this process easier and more efficient. Here, let’s discuss the top 10 best partition manager software.
1....
Music production is the initial stage of any song. Music production can be done either in studios or at home using an online music production software. Here, let’s discuss the top 10 best online...


