
Hallo there!
I am working on a presentation using Microsoft Office PowerPoint 2003 and every other aspect of it is set. What I am not able to figure out is how to get PowerPoint line graph templates to incorporate into my presentation. Is there a way to automate it so that there is a way of just inputting figures and having the line graphs generated? Thanks.
How can I get PowerPoint line graph templates in MS Office 2003?
Hi Jaay,
With Microsoft Office PowerPoint 2003, you can add a line graph and modify it based on the values you set. To do this, follow these steps:
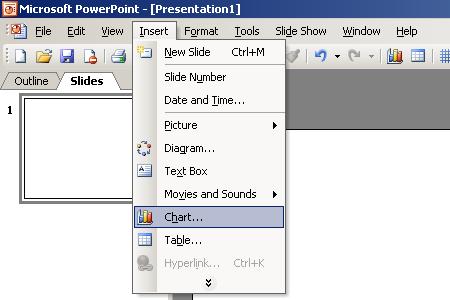
1) Click on the Insert menu
2) Select Chart
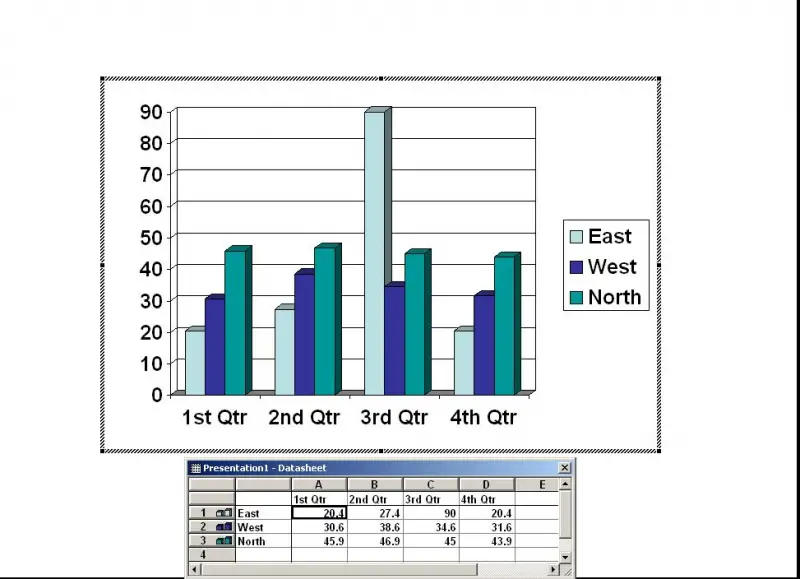
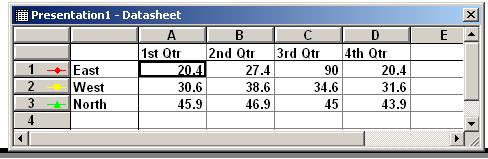
3) By default, it will give you a bar graph that will look like this.
4) To change it to a line graph, right click on an area inside the chart. It will give you a menu like the one below.
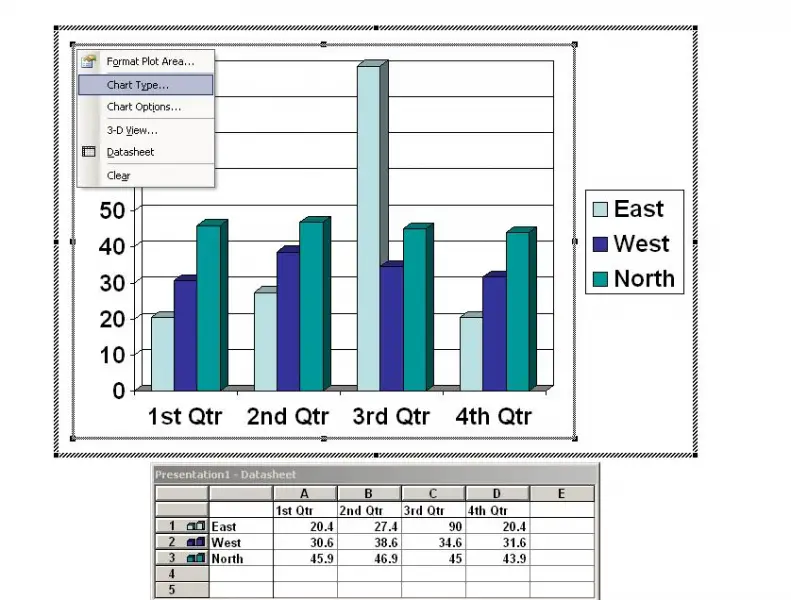
5) Choose chart type
6) You may now select Line graph from the list of available standard chart types.
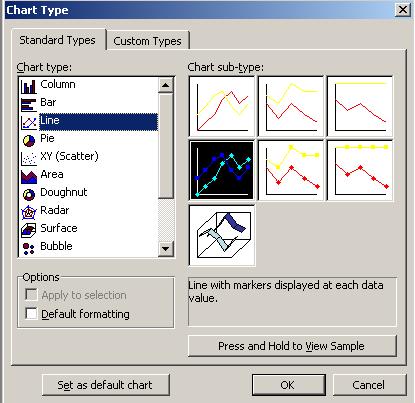
7) Your graph should now look like this

8) All you need to do now, is edit the information in the data sheet to correspond to the values you want to see in your line graph.
You can try other alternatives for chart types to find what best suits your needs. I hope this helps.


