Asked By
tingyong
10 points
N/A
Posted on - 10/09/2011

Good day!
I am working as an office personnel who is obliged to report to the Board of Directors regarding the financial status of the company I am working with. In order to make my presentation more comprehensive, I want to present it in a graphical way to present the whole overview of the monthly financial performance of the operation.
My data is complete. The lacking is the procedure on how to encode or to do it in such a way that my audience could picture out comprehensively in order to come up a right decision for the organization.
Thank you.
I will wait for your response.
Truly yours,
Rubilee Virtudazo
Answered By
tomus
0 points
N/A
#89894
Easier ways to convert my financial data into a graph presentation?
If you working in power point you can take the following step’s to create a chart :
Just go to the top menu bar and click Insert than you will see under the Insert menu Chart creating box “Chart”
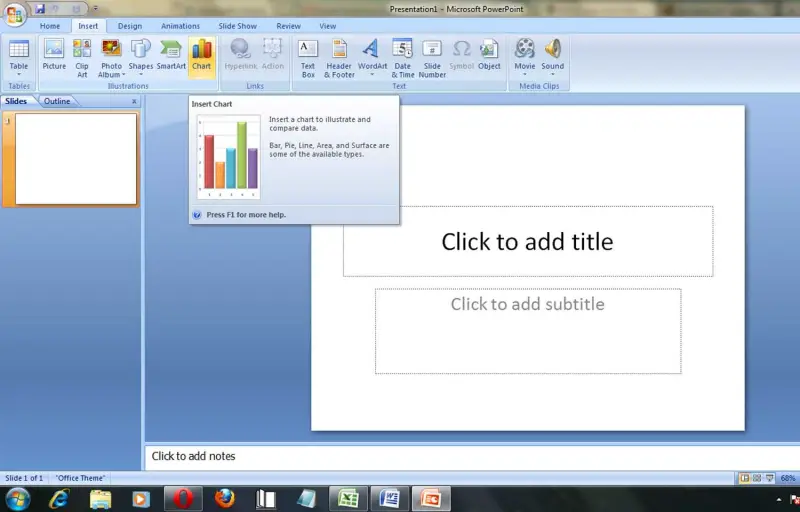
You will see like this:
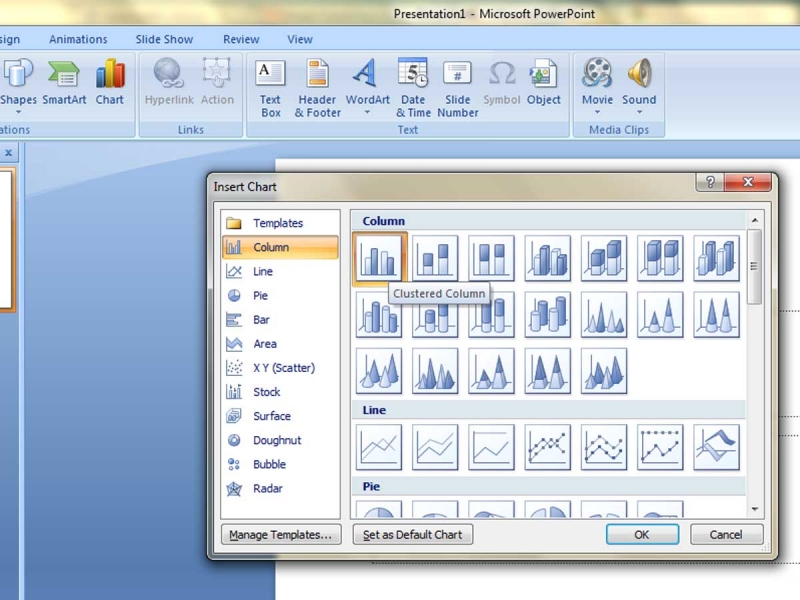
Than select your chart type ,I select first one:
Than come up like this:
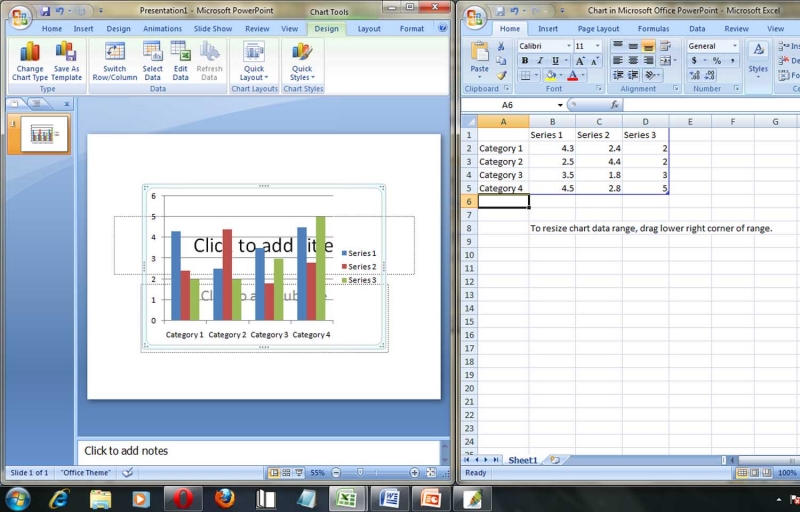
Then just give all the data in the right side. If you have all the data copy and past all the data in the right the graph will change automatically. So you don’t have to think about that so much. If you add another category another category will automatically create in the chart box.
Easier ways to convert my financial data into a graph presentation?
I have also faced the same problem with creating graphs.
I actually don't know how to create graphs.
I want to present it in my classroom as an assignment…
Thank you so much techyv for helping with this problem…
Thanks to all of you…


